


When you acquired .io, what metrics did you focus on at first? How did you choose them?
When we first started using .io there was a lot of new data presented to us which was a little daunting. I decided to focus our efforts on improving one metric and using that to explain to the editorial team the potential benefits of the tool going forward.
Viewability of ad content was becoming an increasingly important metric for ad agencies at the time we started using .io so I decided that the one metric for us to focus on should be Readability as this would help our sales team serve out more ads.
Who was put in charge of increasing Readibility rate?
The editorial team was tasked with improving the Readability of their content. This was a collaborative process between myself and them.
They would process a piece of content, I would check the Readability of the piece and check how we might improve the Readability of similar content in the future.
Can you give us an example of a change made to improve Readibility rate?
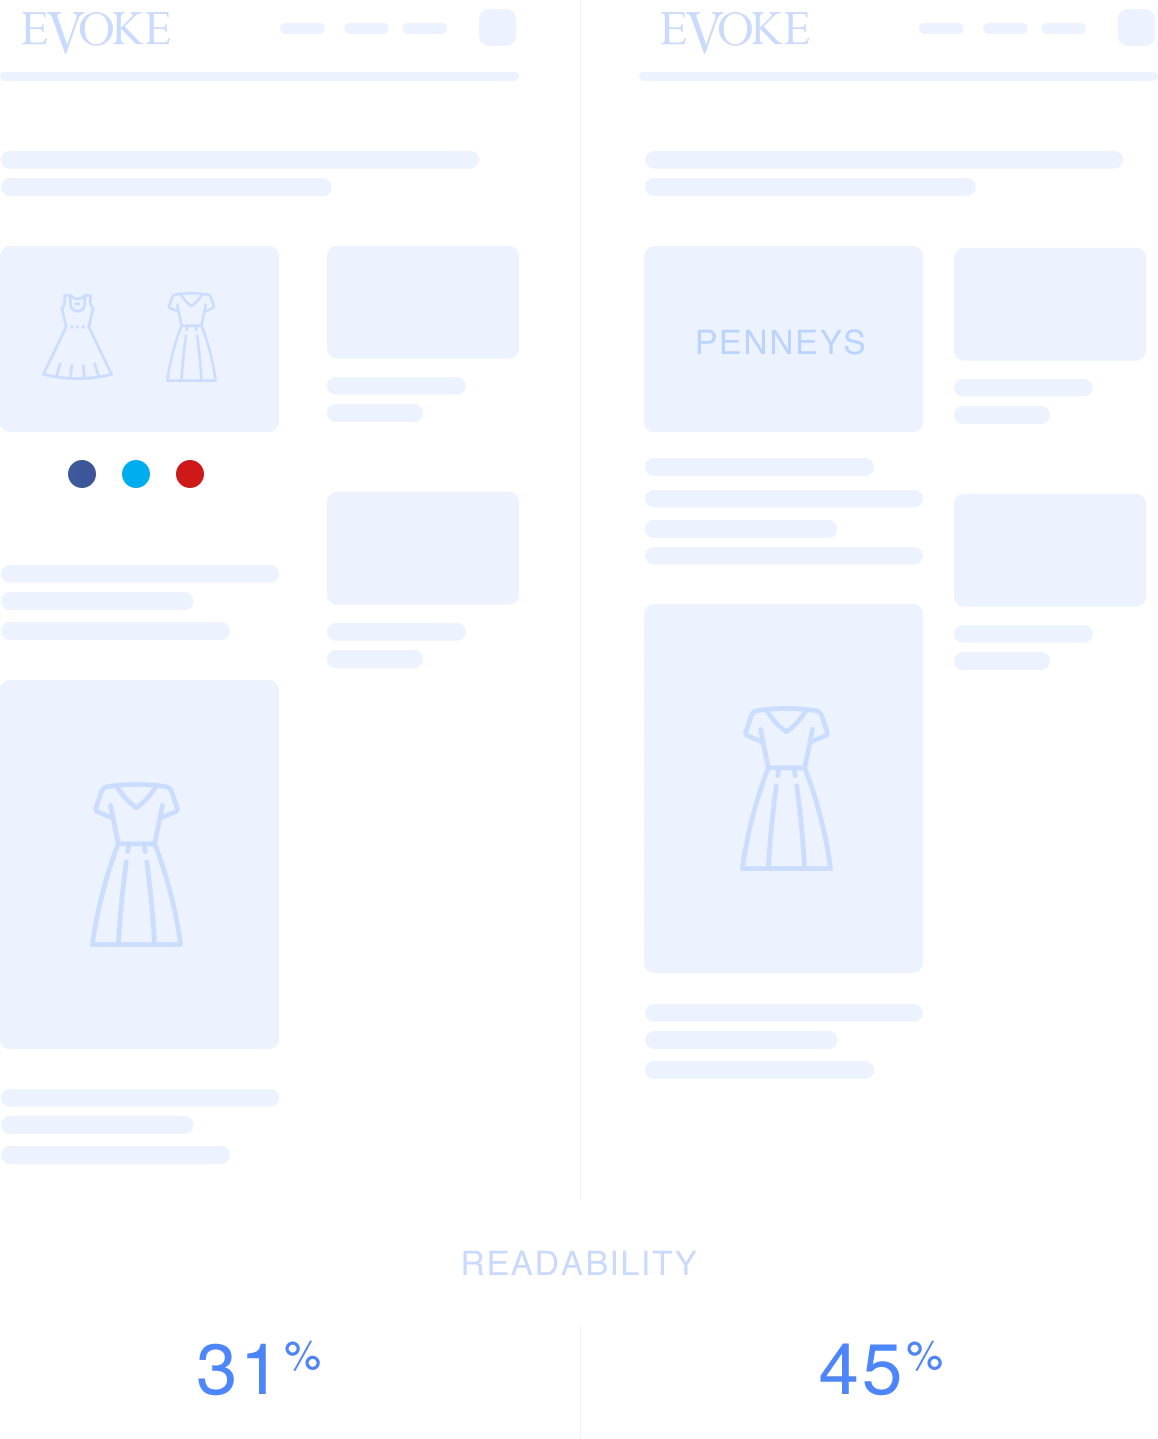
An example of this was with our Style posts. Often we had the item that the article was about as the main feature image. This meant that once someone had clicked into the article and seen the image at the top of the page they had no incentive necessarily to scroll down the article to see any more of it.
By placing a generic feature image at the top of the page and the main image of the article (i.e. the piece of clothing in this case that the article was about) lower down the page we were able to improve the Readability score of such posts.
What improvement did you see after such experiments?

What impact did this increase have on business goals?
We found that the more readers scrolled down a page the higher likelihood would be that they consumed additional content. This meant that our Depth and Recirculation metrics benefited as a results of improving the one metric of Readability.
Try IO on Your Own Data Now!