Firat, from the start your team has been one of the most active users of .io. What features do you use the most?
When we started working with .io, we’ve already had KPIs to achieve by the end of the year. Our main question was “How can we use .io to grow?”. We’ve tried a lot of strategies and decided to increase the number of pageviews by improving the quality of our content.
Today, we work with .io Widget on a daily basis, as it helps us track everything directly on the website. It is also easy-to-use, so our authors didn’t spend much time trying to figure them out.
Which metrics you are focusing on?
Using Widget, we focus on the articles’ pageviews and clicks generated from the main page to see how good our articles are at spreading among the target audience.
On the other hand, we look at readability and average time spent on the article to understand how well our articles are engaging people.
How does Widget on the Main Page help you to maximize the number of clicks and pageviews?
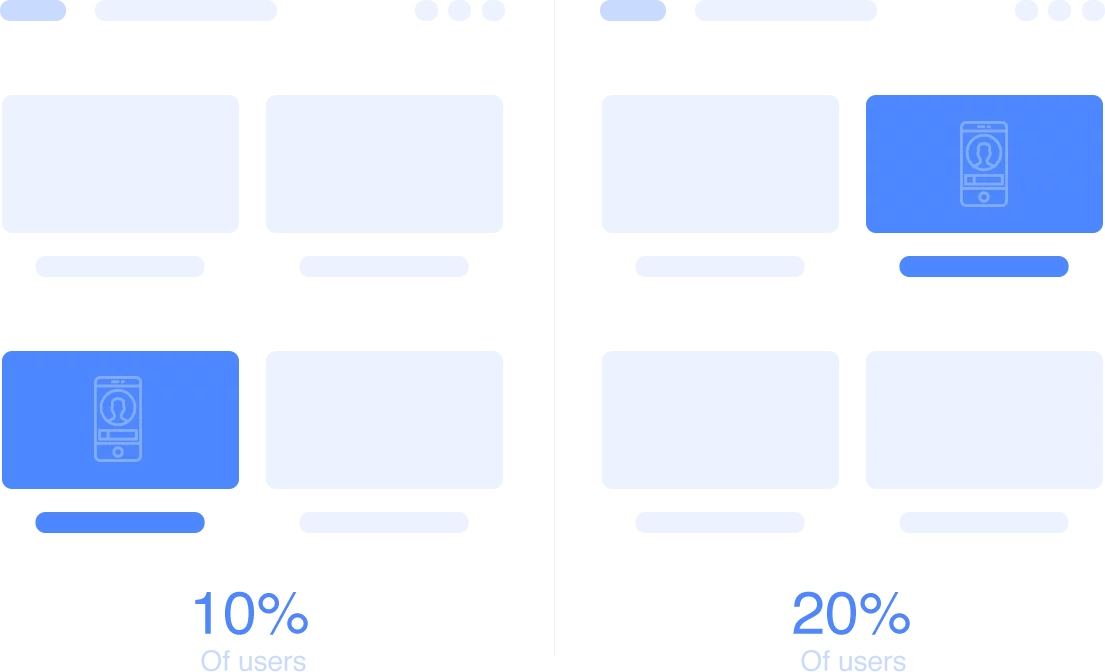
Our authors are using Widget to understand the trend of their articles in real-time. To get this information they look at 10-minutes time frame and compare numbers with the historical data. If the numbers are lower than usual, they change title or picture. It gives us an additional 10-20% in clicks.
While authors are mainly responsible for the article’s preview, the Editor-in-Chief is responsible for articles’ positions on the main page, so he analyzes widget’s markers and ties to fill the top of the main page with the trending articles only.
What is the overall increase of traffic coming from the Main page since you started using our Widget?
That’s impressive! You mentioned that you work with Widget for articles as well to analyze content quality. Can you give us some details?
Our authors are personally responsible for the quality of their content, so widget for the articles is their main tool. They use it to analyze an article’s engagement (readability and average time spent) and find weaknesses.
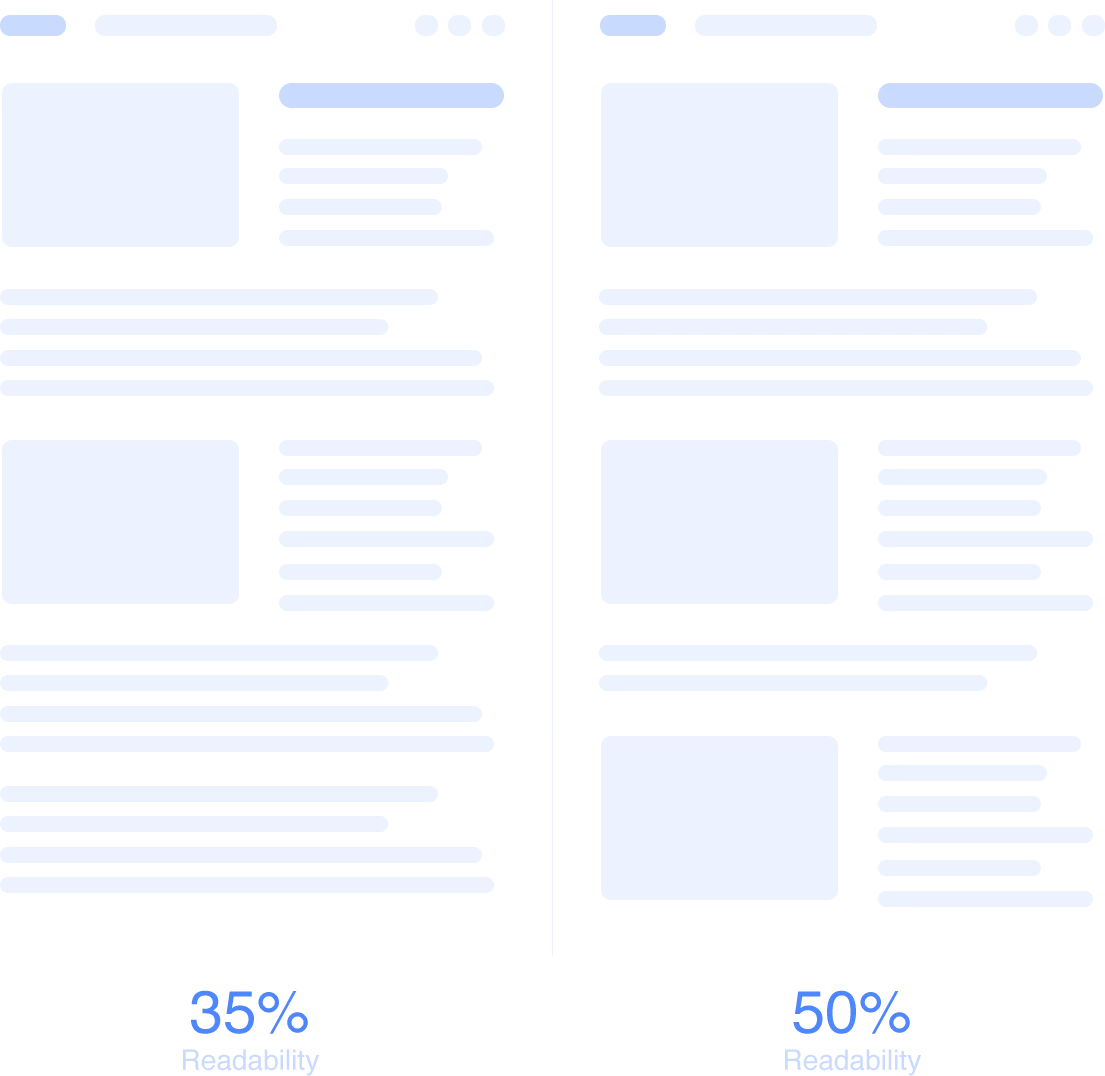
When they see that the article is not performing well in terms of readability, they identify the section where the largest percent of readers bounces away with the help of scrolling map and add video or image. To increase recirculation, they add cross-links.
How have these improvements impacted your project?
Since we started our partnership with .io we’ve found a way to achieve our goal for number of pageviews. Our KPIs are ambitious so it’s not enough just to engage our core audience, we need to engage as many new users as possible, and at the same time increase the depth of our website by improving the quality of our content.
Thanks to IO, we can do it right now.
Try IO on Your Own Data Now!


