
If you want to stay ahead in the global media industry you need to know how to use data. More editorial teams than ever are relying on data to make the most accurate decisions, following the example of the cutting-edge companies leading the industry.
How can your business become an industry leader? By learning how to analyze and use data correctly.
At IO, our mission is to help editorial teams get the most value out of their data. For us, every implementation is a custom solution carefully tailored to meet our customer’s demands.
When our clients start with us the utilization rate of their analytics tools is around 10%. In just a few short weeks we can increase that to 80% through extensive training, sharing expertise, and, most importantly, developing custom KPI systems.
We wanted to share Ringier Africa’s story because of the unique market it operates in and its publishing team’s agility and approach to data.
Ringier Africa operates a new media publisher network across Africa in Nigeria, Ghana, Kenya, Tanzania, and Uganda with a total of 7 million visitors per month, generating upwards of 15 mil pageviews.
We sat down with managing director Tim Kollmann, product owner and East-Africa Director Leonie Elverfeldt, and managing editor and Editor-in-Chief for Ghana Osagie Alonge.
Why Africa? What motivated you to go into business there?
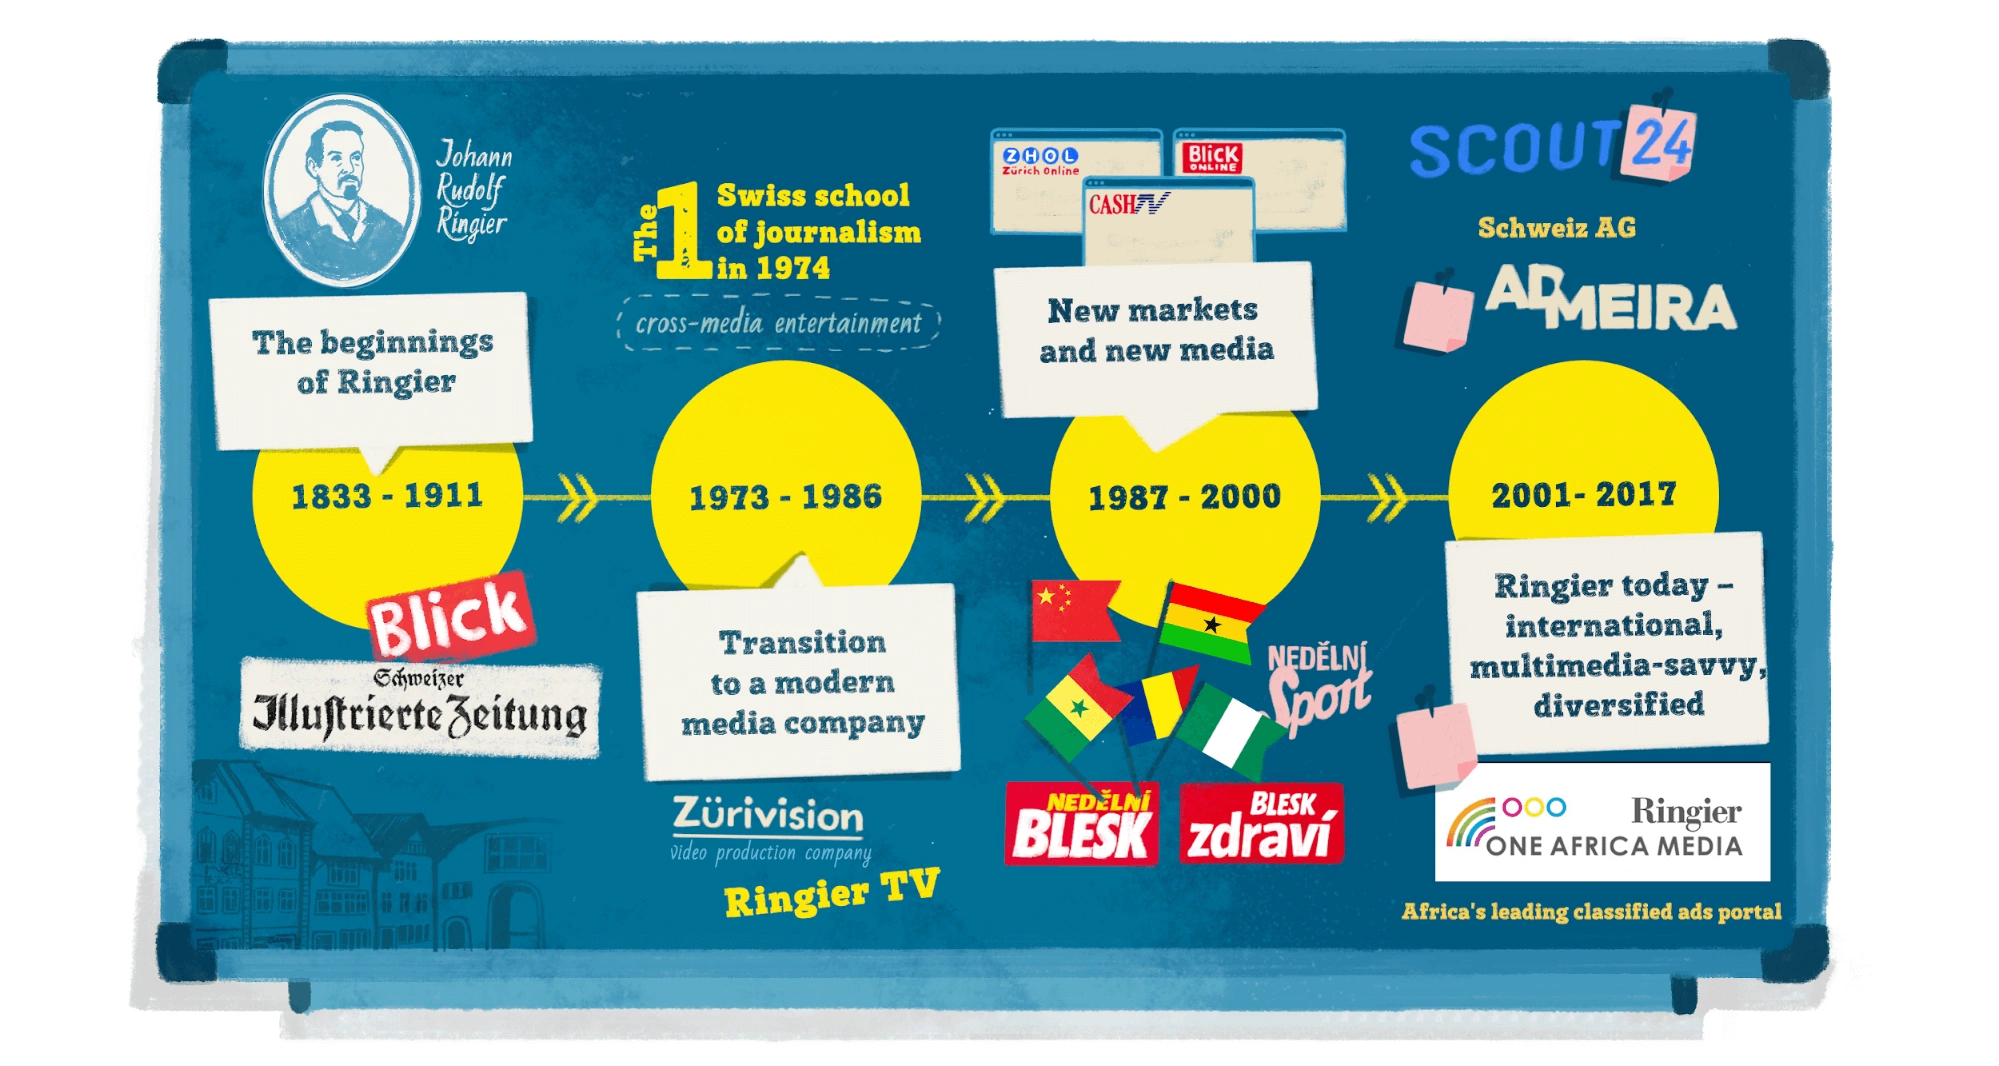
Our parent company was founded in Switzerland - a rather premium market, but not a lot of people. So we ventured out to other markets to expand our business. We went into Eastern Europe in the early 90’s and we’ve become the leader in Poland, Romania, and other countries. Ten years later, inspired by our success in our home market, we expanded into Asia - China and Vietnam. And a few years later, we ventured into Africa because we saw a lot of potential in the market.
What were some of the challenges you faced in the early years?
The challenges were quite similar to those we faced in Asia. A completely different audience and culture, unfamiliar to all of us. In 2011, digitalization and mobile web were just starting to become a thing, especially in transactional businesses, like classifieds and eCommerce, and more so in less-developed markets, like Africa.
How big is your team today?
Without the operational overhead, we have about 180 employees. Half of them are in Nigeria, about a third in Ghana, and the rest in Kenya.
How do your teams communicate? Do you use any collaboration tools?
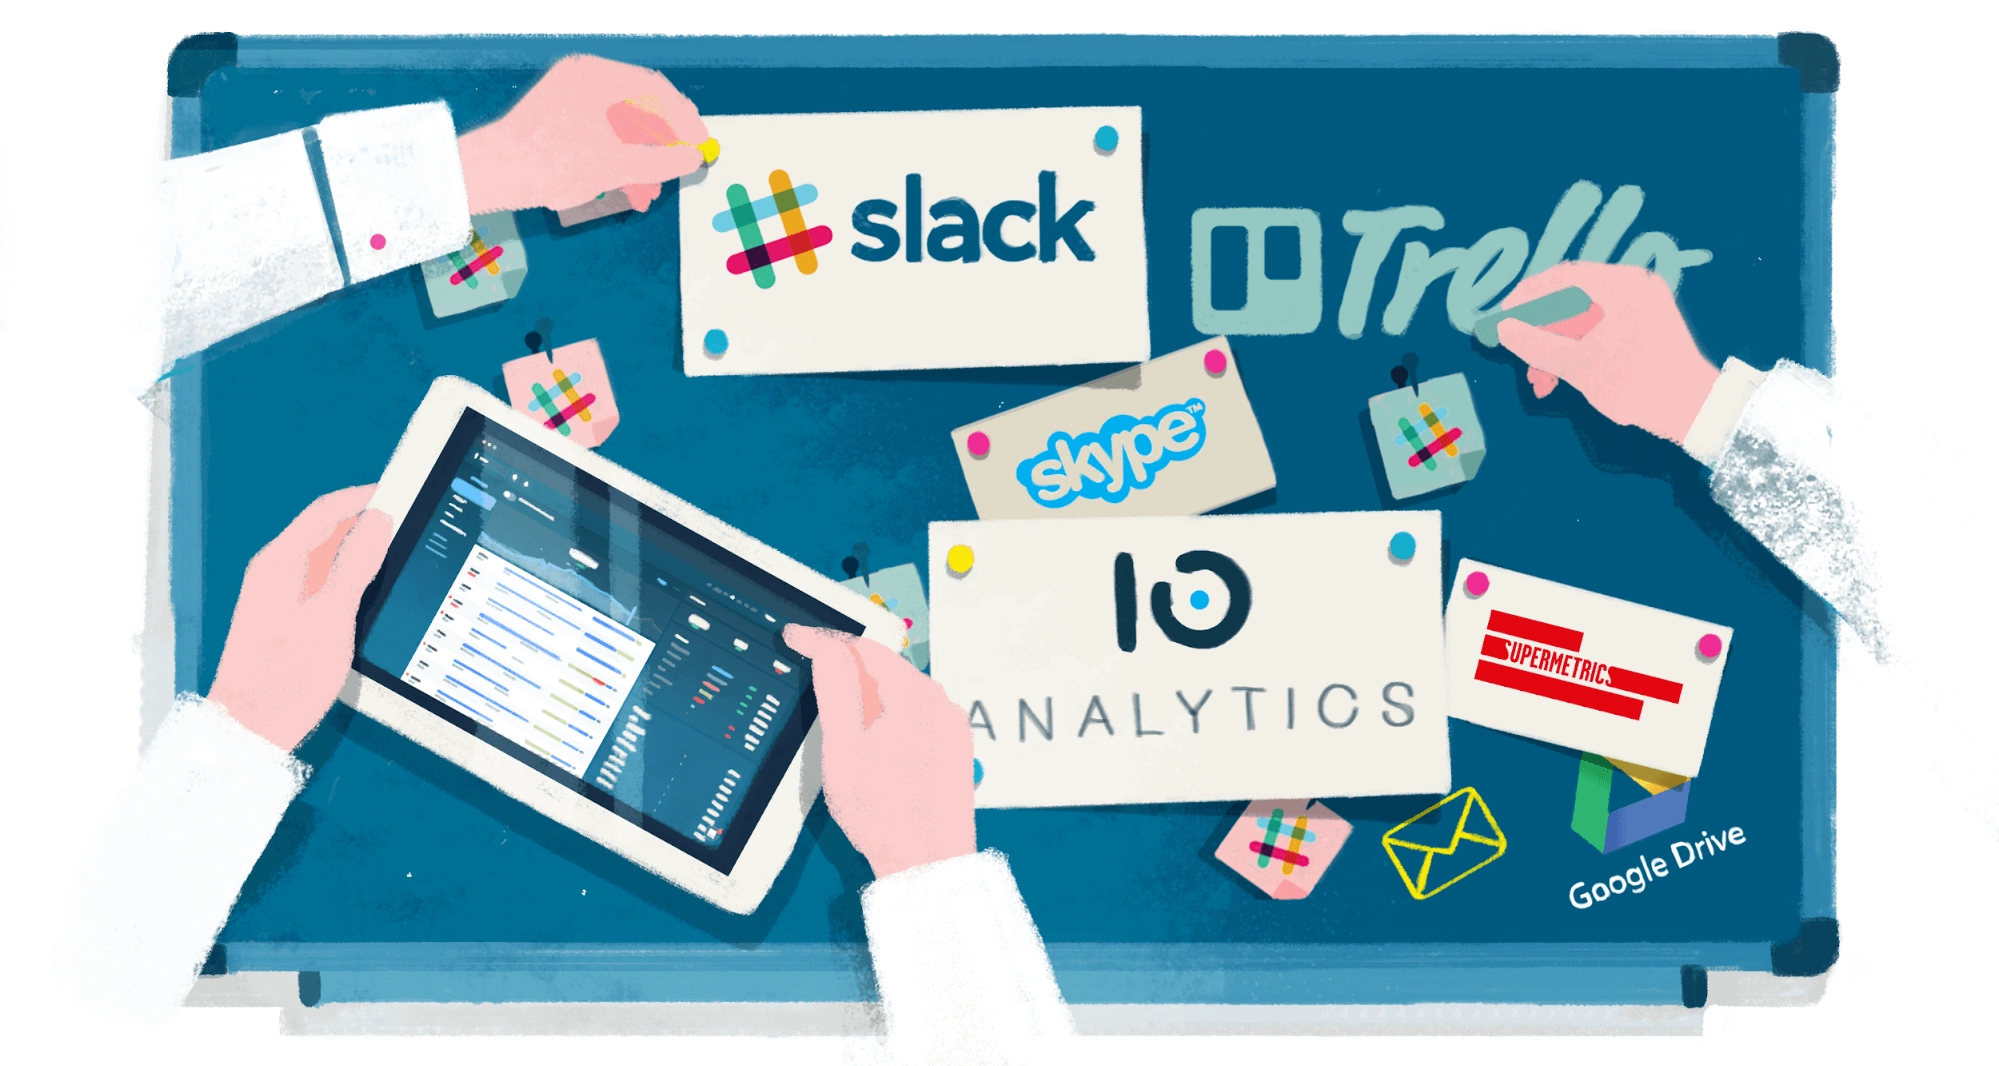
Predominantly, we use Slack and Trello to collaborate. Skype is widely used because we are a distributed team. Supermetrics for Google Drive, of course, and we still email, but more at the product organization level.
Which tool does your editorial team use the most?
Our writers use mostly Slack. Creative and marketing teams do more work in Trello. And of course, Salesforce [is used by] the finance team.
Slack came up a lot in customer feedback, so we successfully integrated Slack into our platform. If you are curious about Slack, you can read more about it here.
Would you say your team is data-driven?
We are definitely trying to be. At Ringier, we have a very large amount of historical data available to us, and we use it a lot to drive business decisions and strategies, especially for editorial and video. And we’ve introduced a number of data analytics tools to help the team understand the data better.
Could you elaborate on that? What tools do you use for analyzing data?
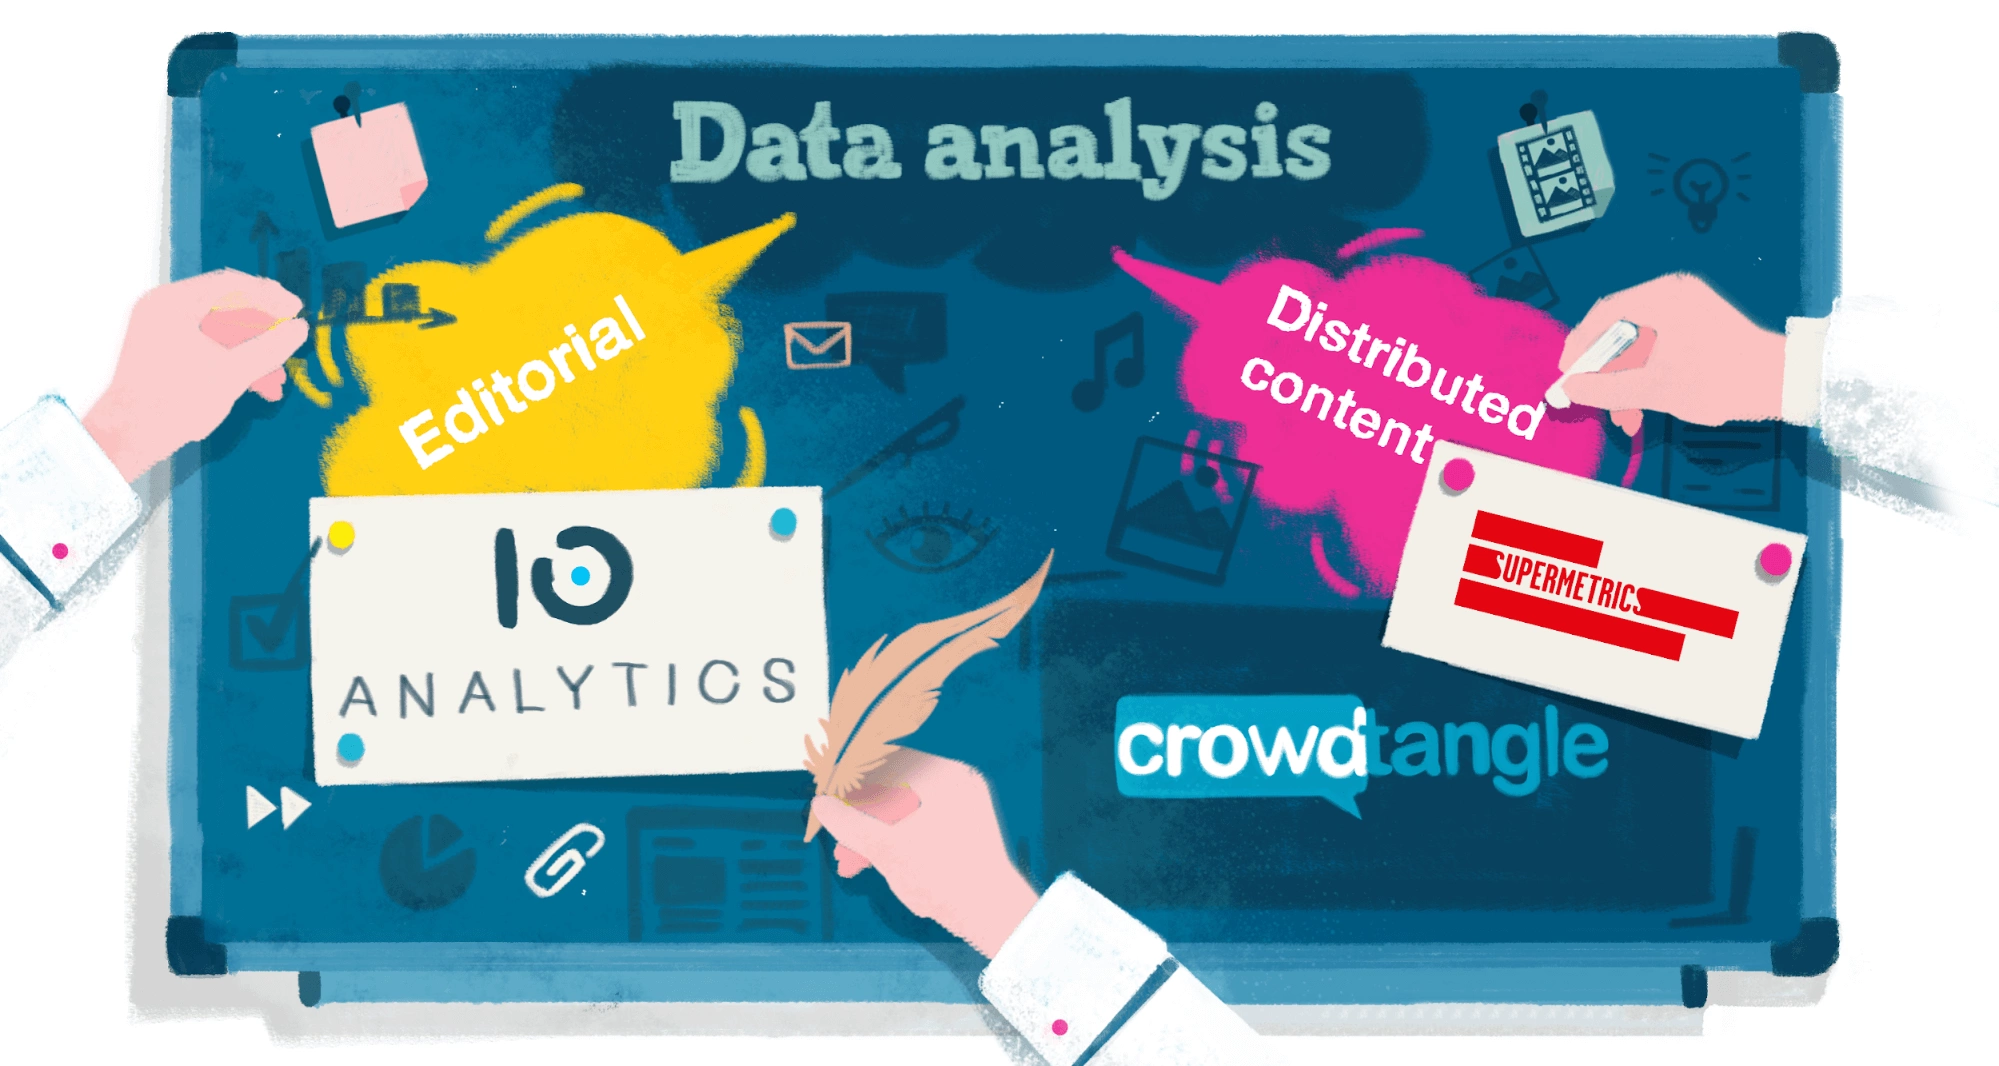
It varies across the different business units. For editorial, we are mainly using IO Technologies, and since we do distributed content, we look a lot at what Google Analytics has to offer, and we aggregate this data via Supermetrics.
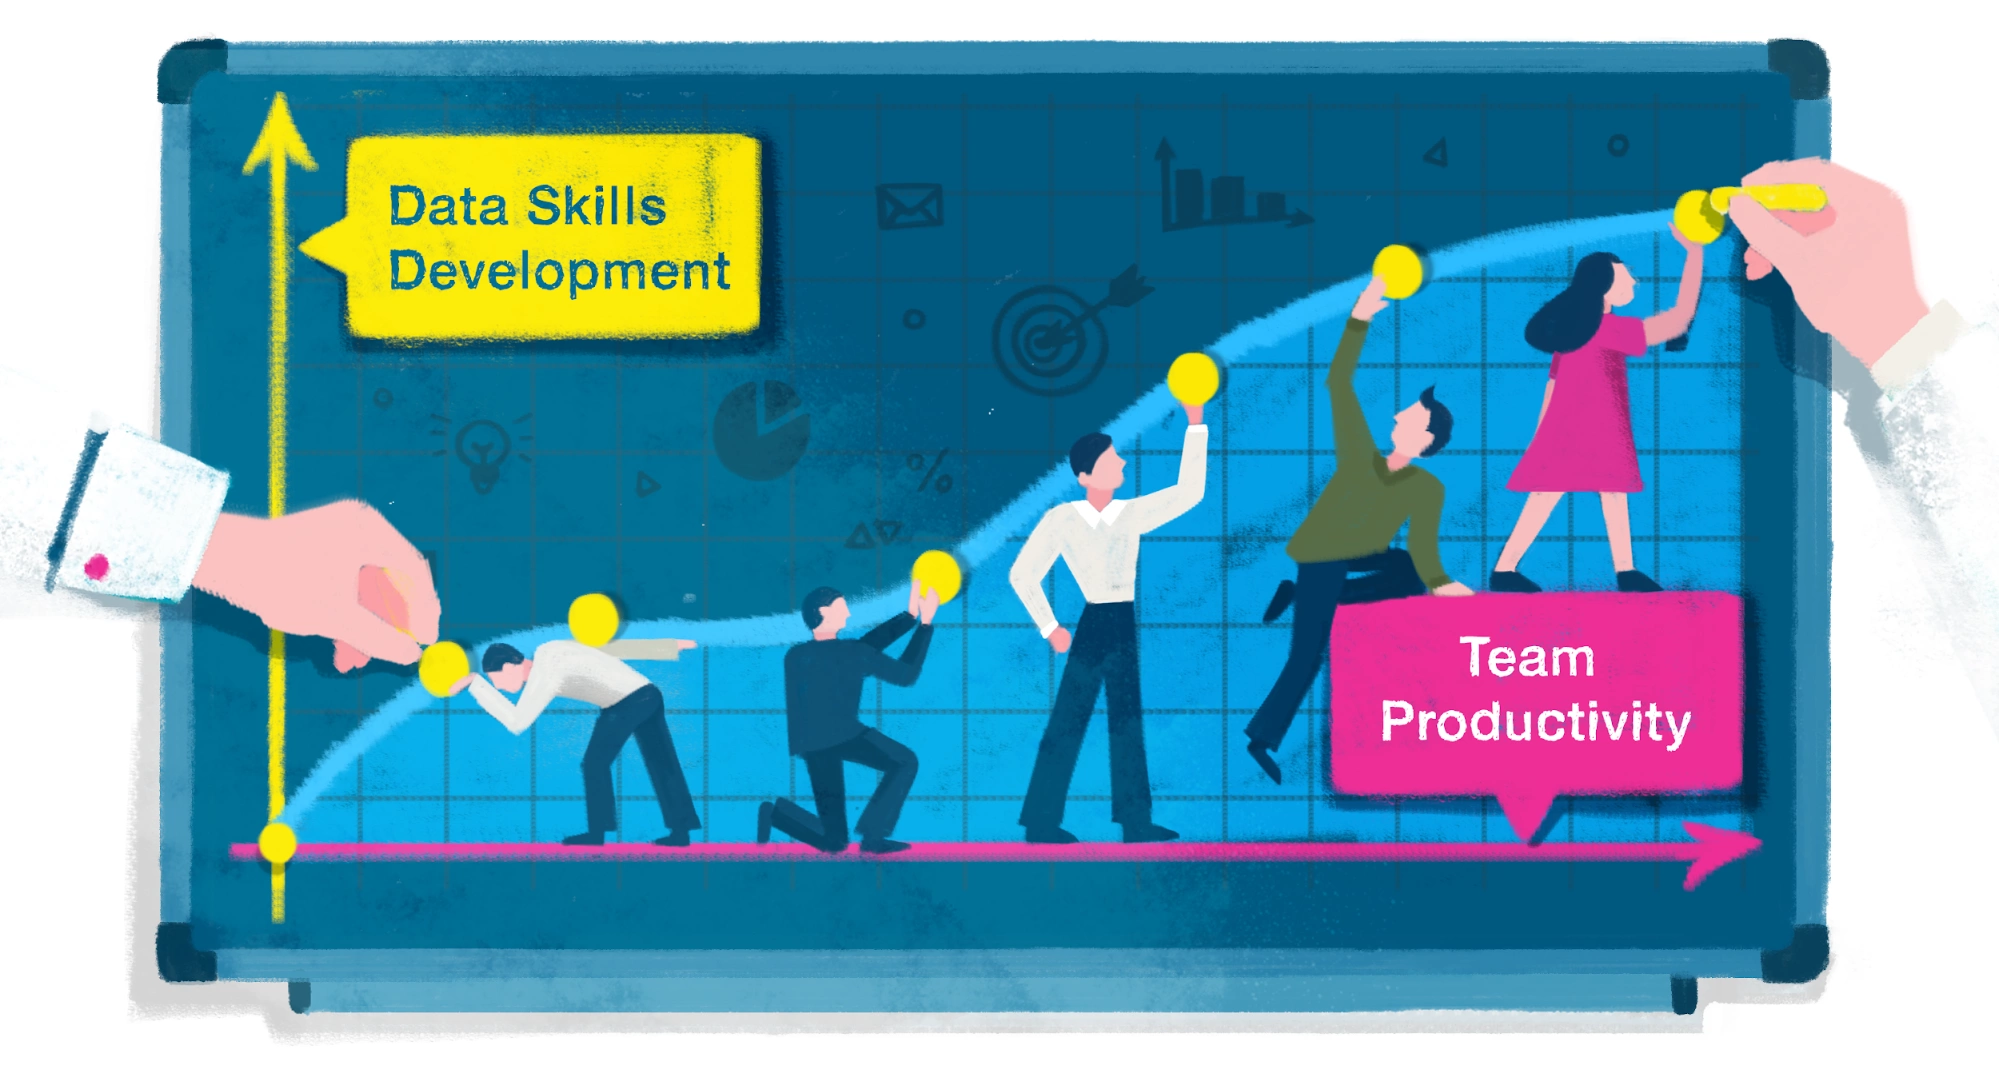
Is there a direct correlation between using analytics tools and productivity?
Yes, absolutely. We have seen it greatly improve our team’s productivity, and that’s one of the main reasons we use these tools. You have to possess a certain level of soft skills to learn how to use this feedback so you can be more productive and make better decisions.
Does analytics create competition on the editorial team?
Yes, of course. We reward our editors when their content ranks highly, and naturally, that creates competition. By looking at historical data, we are able to identify our top performers over time and see individual and team trends.
What percentage of the team actively uses data tools?
About 15-20% are actively using them in one way or another. Everyone is exposed to the data produced by these tools and dashboards, but only a few have direct access to them.
We installed video monitors throughout the office, where we display our IO dashboards for different businesses and regions. This allows everyone on the floor access to important statistics to see how our business is doing.
What about your authors? Are they looking at their own statistics?
Our authors receive a daily digest from IO Technologies with detailed statistics [each digest contains information on page views, top articles and authors, readability and much more]. This data motivates them to be competitive and smart in their decisions, and help them keep their eyes on the goals and maintaining a high level of standard.
Do you share individual successes with other team members?
We think it’s important to share both our wins and losses with the entire team, and that’s why during our weekly meetings we discuss and analyze both. It’s a good learning experience for the team.
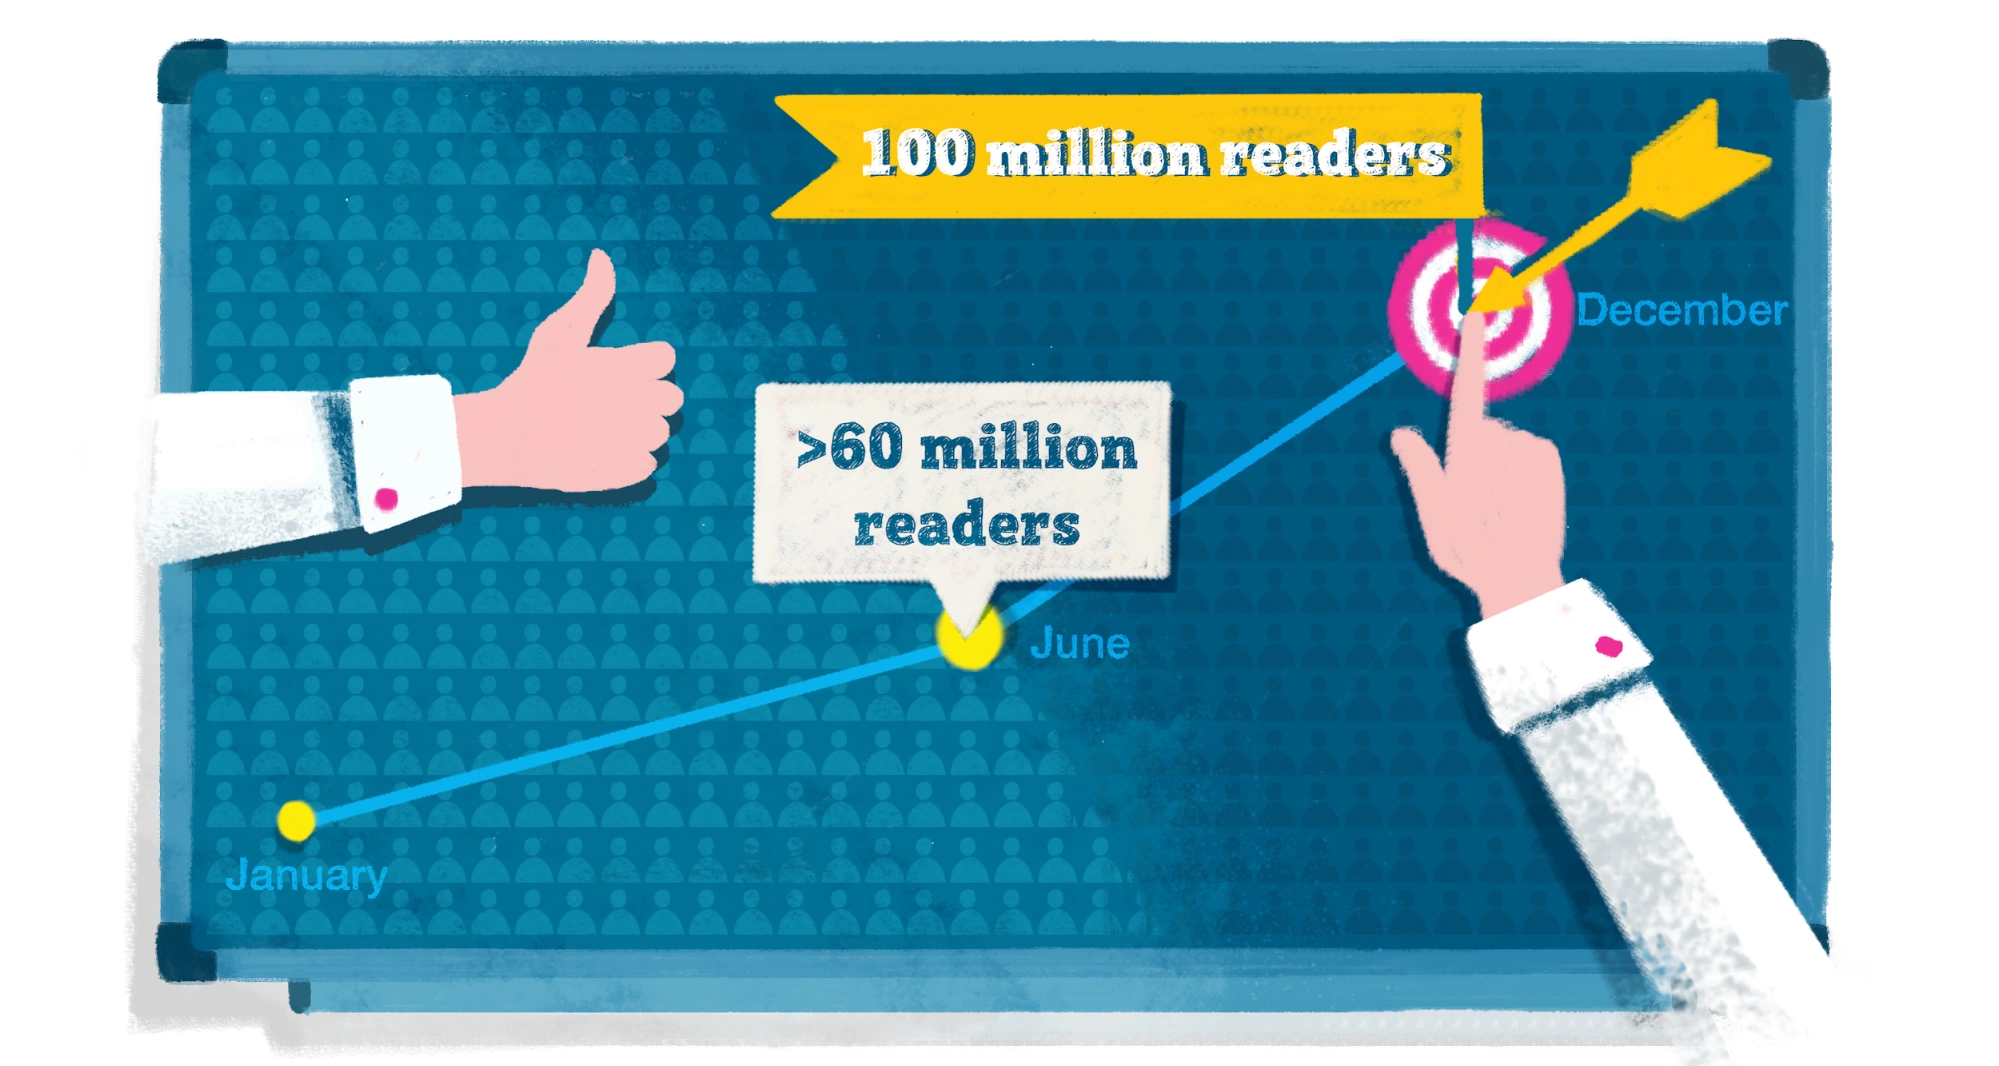
Finally, what are you most proud of thus far?
We consistently grow and reach new audiences, year over year. At the end of last year, we challenged ourselves by setting an aggressive goal of reaching 100 million readers before the end of 2017. Through June, we were over 60 million. Of course, it’s still early to say that we’ve succeeded, but we know that it’s within our reach.
Looking at the numbers is critical, but being passionate about constantly raising the quality bar is just as important. As businesses evolve so does their data, and that’s why keeping the data team and tools up to date so important.
Utilizing data and analytics requires the ability to manage multiple sources of data and build advanced analytics models, and if you can master these skills, you can master the media.
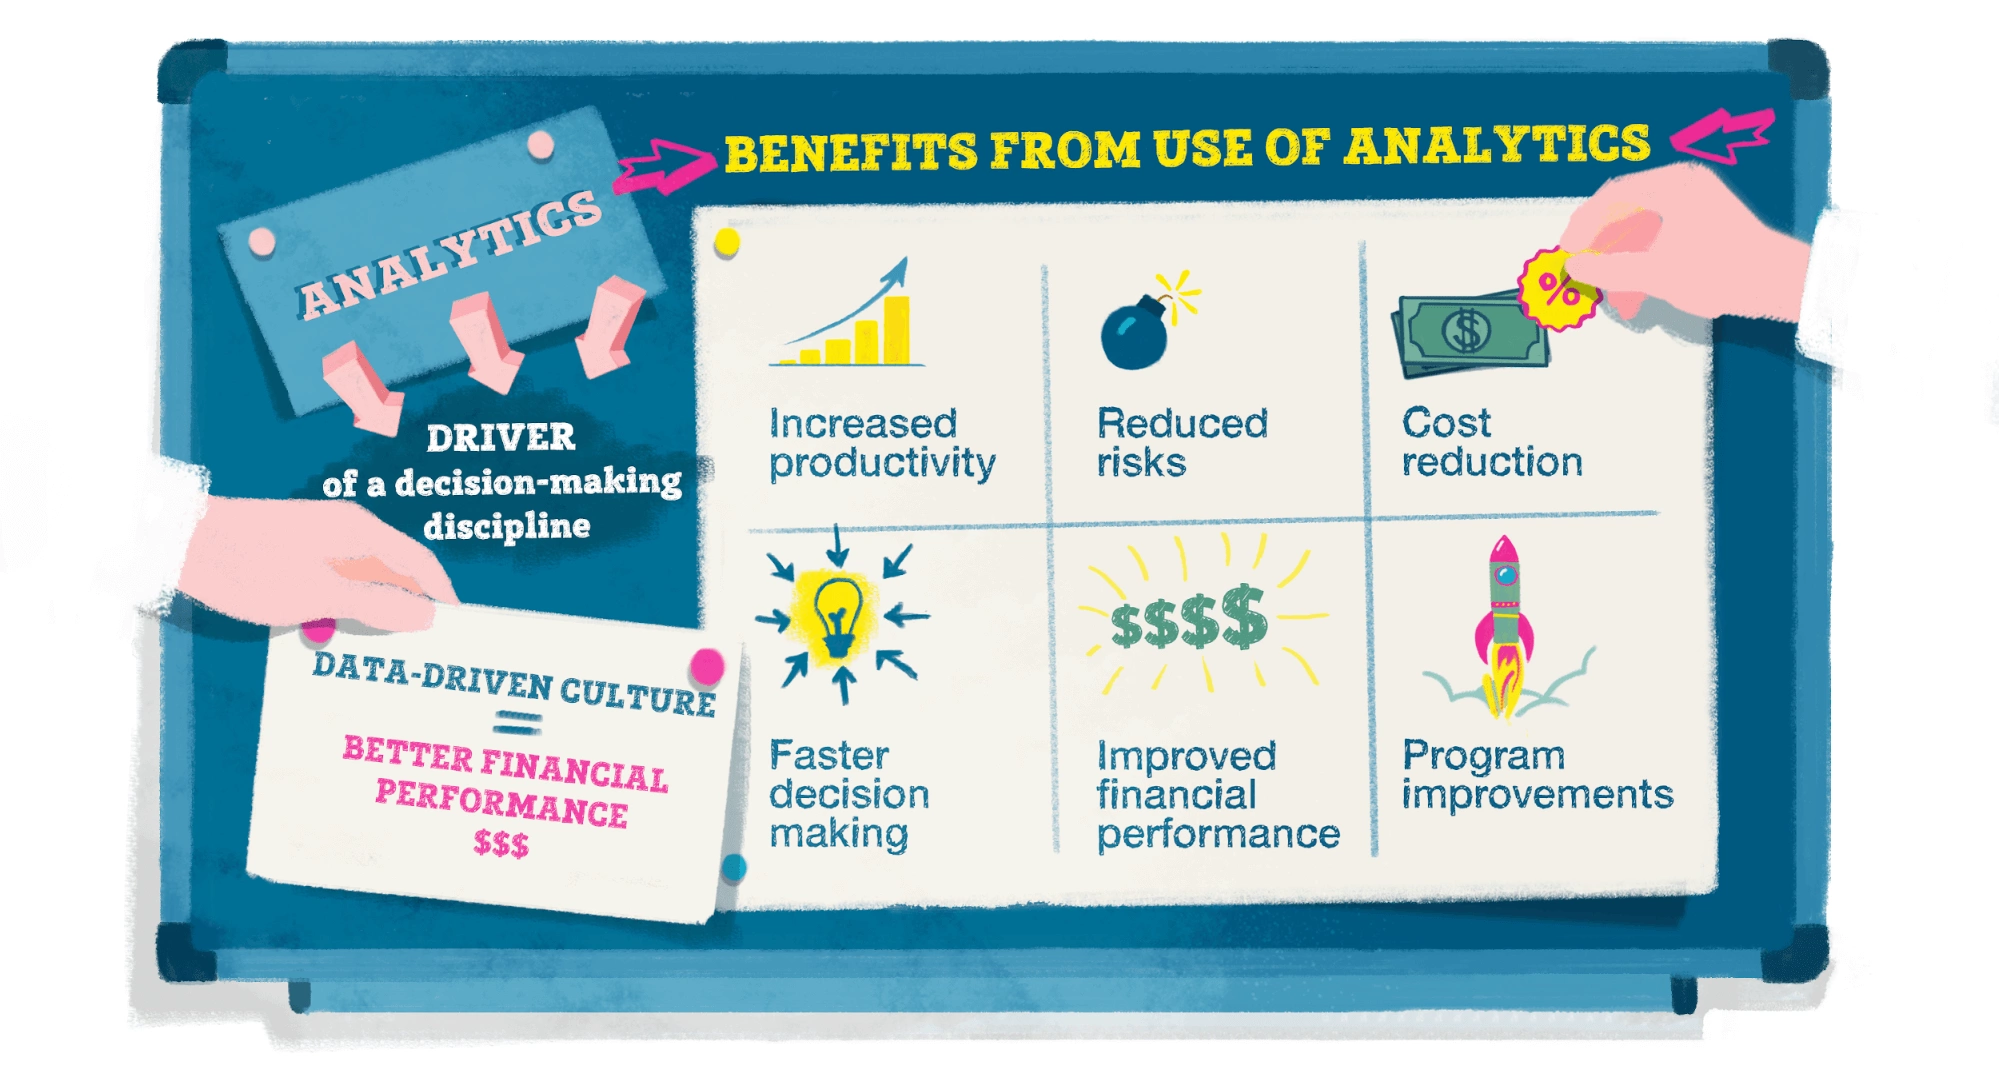
As Ringier’s team discovered, data analytics is not just a tool or a technology, it is the driver of the decision-making discipline you need to work at the cutting edge of the media industry.
Being data-driven has already brought results to Ringier: Their project Pulse Live Kenya has won the award of “Most Innovative Digital Media Publisher’ at the Digital Media Awards 2018 in Nairobi, Kenya. This award aims to recognize Brand, Agencies and Individual excellence in the digital space.
This is the proof of the effectiveness of the data-driven approach. IO is proud of clients that grow so quickly. Motivating a large team of nearly 150 members to work with data on a daily basis is a brilliant result acknowledged by others.
Try IO on Your Own Data Now!