


What insights did you receive while working with IO dashboards?
The thing I liked the most about IO's dashboard is the flexibility to make custom reports for different roles in our team. We tried a couple of different tools before and we saw the same scenario each time. Everyone would get all sorts of useful data and nobody was looking at it. But, with IO, we can show specific sets of metrics to different users. Editors can focus on the things that matter to them, journalists can only see info about their own articles, etc.
So, for me, it's not about the insights I have received from the dashboard as much as it is that everyone can see metrics that are relevant to them, actually look at them daily, and then make improvements.

What features of the IO Dashboard do you use the most?
Well, if I must choose only one thing, it would probably be the CTR report. It's just so useful with identifying pieces of content that are performing well on homepage but we have somehow missed it and are poorly positioned. We also use the dashboard to select only Main page traffic so we can make our homepage more efficient. In the past, we often made the mistake and used our top spots to display articles with great number of pageviews, without even realizing that 70-80% of traffic was coming from social and homepage visitors weren't really all that interested in them.
As for the Main page Widget, It is a very useful thing to have a quick glance at how your homepage is performing, but it is also very dangerous to make decisions without knowing where the traffic is coming from. We explore the detailed charts to sort the things out.
Which metrics are you focusing on?
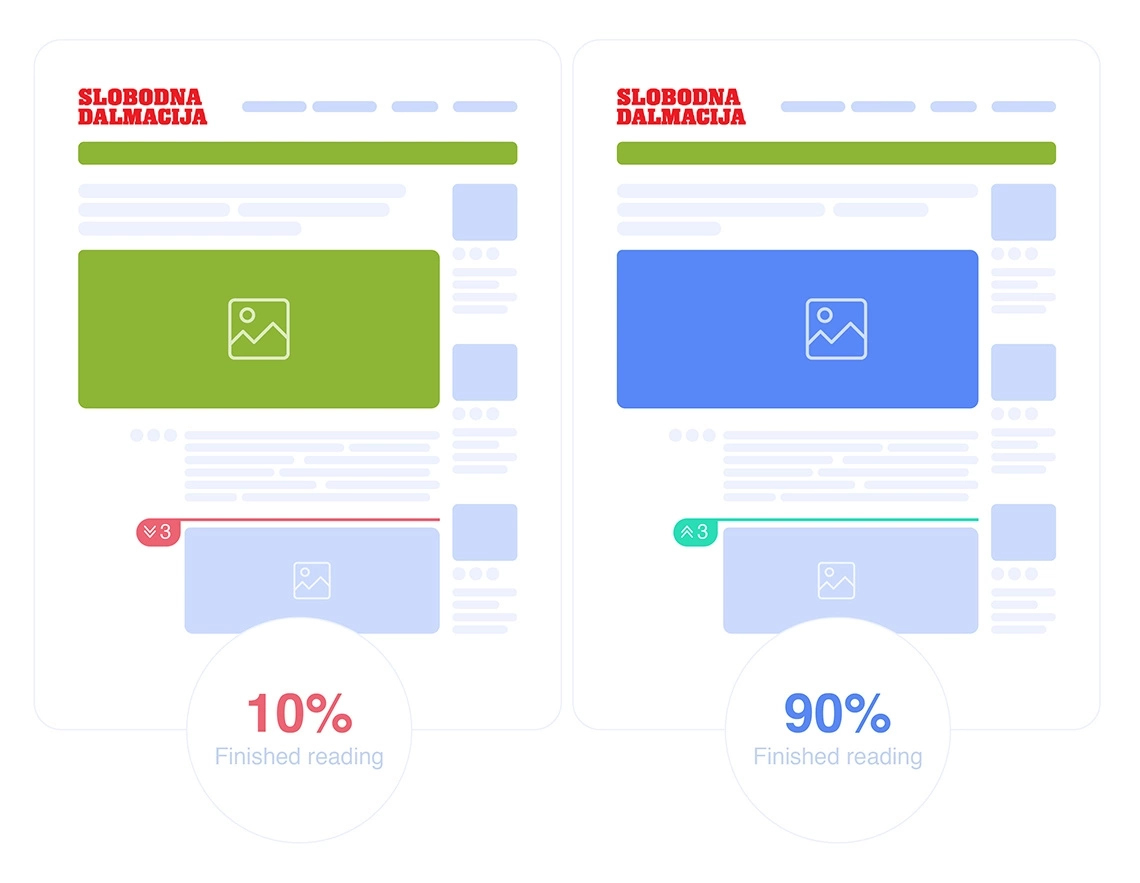
Right now, it is Finished reading percentage that we are mostly focused on. Since we are transitioning from print to digital, lots of our journalists are only now discovering the perks of getting the feedback on how many people clicked on their story. And, of course, they measure success with pageviews that is such a dangerous thing to do. Now I'm trying to make them understand that success is measured with combination of metrics, not just pageviews.
Does it bring results to your newsroom? Can you please share stats or examples with me?
It does, definitely. When we were focusing on homepage effectiveness, we saw a 15% rise in pageviews in 2 months, and similar thing happened when we were pushing for better recirculation numbers.
Overall, now we see authors using a lot of embeds, videos, polls, quizzes, links to the related content etc. in their articles. No one was really thinking about cumulative impact of those actions before. But now, when they can look at Recirculation percentage rising and the effect that it has on pageviews and AdSense revenue, they really understand why it is important to make that extra effort.
A tip from Marin Katušić, Editor-in-chief at www.slobodnadalmacija.hr:
Try IO on Your Own Data Now!